Monday, February 19, 2018

Service Fabric Application Gateway

Service Fabric applications locate other SF services using the Service Fabric Application Gateway proxy, a service that's provided as part of the whole SF environment. It's necessary if you plan to dynamically locate other SF services, especially when they move and/or scale in and out.

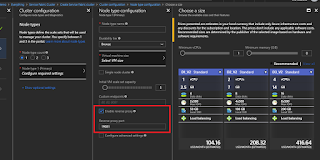
SF App Gateway is created if you enabled reverse proxy during the SF provisioning process. In the portal, here's the UI;

Reverse Proxy Setting During Provisioning

If you forget to do that, the scale set VM cluster will be constructed without the necessary configuration and service listeners, and attempts to access the proxy from a program will yield this vague error message:
System.Net.Http.HttpRequestException: An error occurred while sending the request. ---> System.Net.WebException: 
Unable to connect to the remote server ---> System.Net.Sockets.SocketException: No connection could be made because the target machine actively refused it 127.0.0.1:19081
This is a clue that FabricApplicationGateway.exe is not running on that particular node (VM). If you attempt to manually start it on the VM, it'll immediately crash unless properly configured.

To correct this, you'll have to manually edit a configuration file on each VM in the scale set cluster of your SF installation. Follow these instructions, valid for Service Fabric 6.1.456.9494:
  1. Log in to the VM using Remote Desktop, using credentials you specified during Service Fabric VM configuration. Use your Service Fabric DNS name as the machine name. The first machine in the cluster will be at port 3389; subsequent VMs will be mapped to incremental port numbers, e.g. 3390, 3391...
  2. Change to directory C:\Program Files\Microsoft Service Fabric\bin\Fabric\Fabric.Code.
  3. Edit file FabricHostSettings.xml. Notepad is fine for this.
  4. On or about line 61, set this value to true:
    <Section Name="HttpGateway">
      <Parameter Name="IsEnabled" Value="true" />
    </Section>
  5. On or about line 170, note the following settings and update them as shown here. The values will probably be blank initially. Port 19081 is the default used by Azure, but can be another value so long as your application knows it.

    <Parameter Name="HttpApplicationGatewayListenAddress" Value="19081" />
    <Parameter Name="HttpApplicationGatewayProtocol" Value="http" />
  6. Save the file and reboot the machine. Rebooting isn't strictly necessary, but it'll get Service Fabric components to fully restart with the new configuration. Note that rebooting may cause a service outage.
  7. Remember to check that Reverse Proxy box during SF provisioning, next time!
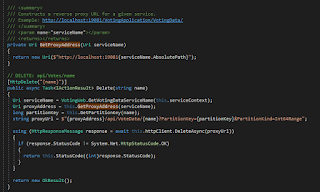
With the changes above, your application can now call upon the local proxy installed on each SF VM node, as shown below (sample code from Microsoft Voting sample):

Service Fabric Application Proxy Usage


Service Fabric Temp Disk - Gotcha!

During a recent project with Azure Service Fabric, I encountered errors after provisioning which prevented proper SF operation, and ultimately led to an interesting discovery.

Service Fabric is Really IaaS


Azure Service Fabric is essentially just an intelligently managed IaaS environment. Many parts of an IaaS environment are inherently static, that is, once a particular performance level is provisioned, it remains at that perf level.

During Service Fabric provisioning, a choice of VM size is offered, at which time it's very important to get the size right (it should be sized for anticipated peak load). Too big and you'll waste money; too small and the environment won't operate properly, or will yield poor performance. Changing VM size later can cause service interruptions and is generally not recommended. The VM size is applied to all nodes (VMs) of a scale set (or cluster) that's created by SF provisioning. The scale set is initially set to a fixed size that can be manually changed, and later be configured for automatic scaling.

Being Frugal


In my personal Azure test environment, I typically provision lower-end VM offerings to save money on small, short projects. This works fine for small apps with no load beyond my own experimentation. I do my project, then tear-down the environment, or if it's something I intended to keep, I switch it to a free tier.
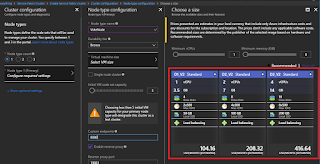
VM Sizes Offered During Service Fabric Provisioning

When it came time to build a Service Fabric environment, I used the same economical approach. Rather than choose the suggested VM at a cost of $104/VM/month, I chose a smaller one at $44/VM/month. The portal's UI allowed this choice, and during the validation phase it passed successfully. But all was not well, as I was to see.

If You Build It, They Will [not] Come


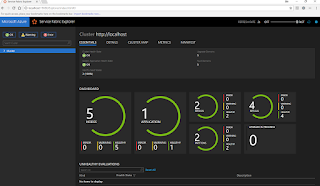
After about 30 minutes for the new SF environment to be created and brought online, I checked the results via the SF monitoring web page. This page is created automatically when a SF environment is created, and by default is available at http://<your URL>:19080/Explorer/index.html#/. Here's what that looks like with a local 5-node setup.

Service Fabric Monitor - Normal

But, for some reason, my brand-new Azure-based Service Fabric booted with warnings, and when I ran my SF app, the environment quickly went into failure. I wasn't too pleased - isn't Azure technology supposed to be better than that, and self-heal in this case?

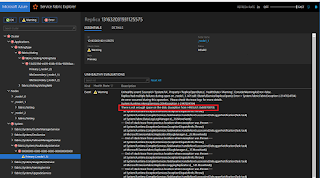
Digging-down in the SF Monitor, I noticed a single status line that gave insight to the failure - a VM disk was too full, despite having just been provisioned. As a side-note, Service Fabric VM disks are now configured as Managed Disks, an improvement over legacy disks that required traditional monitoring and oversight; Microsoft takes care of that now.

Disk Full
Disk Full
A disk-full issue is normally fairly easy to resolve, but the bigger question is how could a brand-new SF installation yield such a condition, and especially with Microsoft-managed disks? My app hadn't even started yet. Logging-in to one of the VMs showed 100 GB of free space on the C: system drive, and several GB free on the temporary D: drive. The disks weren't full.

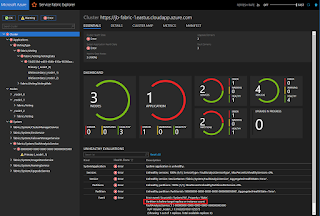
In short order, the disk-full warning caused a node failure, and that escalated into partial cluster outage and lots of red on the screen. The error message "Partition is below target replica or instance count" is a verbose way of saying that a node is down, which implies that the node failed due to environment or startup code.

Node failure Caused by Full Disk


Oh Yah, RTFM


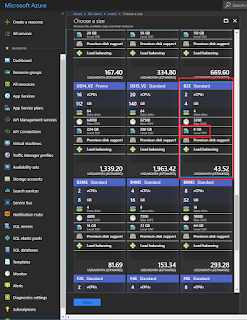
After some non-trivial research I discovered a clue. Microsoft's Service Fabric capacity planning recommendations state a requirement of a 14GB "local" disk. The word "local" isn't well defined; my little VM had a 128GB "local" system disk, and a 8GB "local" temp disk. Nonetheless, I made the inferential jump that my 8GB disk - despite having several GB of available space - was too small.

Too-Small Local Disk in Selected VM SKU
Even though my application wasn't going to touch the D: temp drive, I rightly guessed that Service Fabric had intentions for its use, and thus the implied requirement that the size be larger. I wish they'd just stated that explicitly.

Fixing It


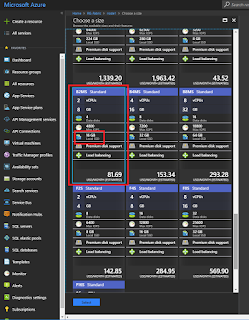
To check my hunch, I up-sized the VM SKU, as seen below. I didn't care about a service interruption, but since this change takes down the cluster, it explains the critical guidance to pick the right (peak-load) VM SKU during provisioning:

Just-Right Local Disk of New VM SKU
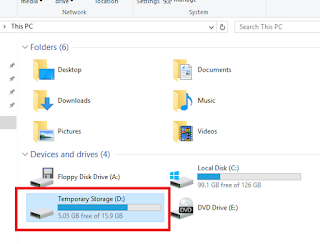
With the change made and several minutes later, I logged into one of my SF cluster's VMs and noted the disk space consumed by the D: temp drive. Notice in the image below that Service Fabric has used about 10GB, even before my app started running. So there's the 14GB justification - and you can guess what happens if D: is only 8GB.


VM Local Storage Free Space
At last, my Service Fabric cluster was fully operational and without error!

Lessons learned

  1. Even if you know how to do something, double-check the documentation for tiny details that could derail your project.
  2. Even if Azure "validates" your configuration, it could still be invalid and non-functional.
  3. In certain parts of the Azure ecosystem, changing a resource configuration can take the environment down for a period. Not all Azure components - even those in pseudo fault-tolerant scenarios - continue operating during a reconfiguration.


Tuesday, February 6, 2018

Installing Service Fabric Locally

This'll be a very brief post with a problem and quick solution for installing Service Fabric on your local development computer. I hit a snag during installation.

To run Service Fabric apps locally, you need to first download and install Service Fabric. Installation requires reading the instructions and running a PowerShell script; it's not quite as easy as running a setup.exe and watching it go.

Unfortunately, if you try installing to a path containing a space, such a C:\Program Files, the provided PowerShell script CreateServiceFabricCluster.ps1 fails:

PowerShell Script Path Error

The solution was to places quotes around the file path string. This had been done for another variable in the code, but was apparently overlooked for this one.

Original code (in CreateServiceFabricCluster.ps1, line 58):
$DCExtractOutput = cmd.exe /c "$DCAutoExtractorPath $DCExtractArguments && exit 0 || exit 1"
New code (note the tick-quote delimiter preceding the double-quote characters around $DCAutoExtractorPath):
$DCExtractOutput = cmd.exe /c "`"$DCAutoExtractorPath`" $DCExtractArguments && exit 0 || exit 1"
After the modification, the path containing spaces is quoted and is accepted for execution properly.

Saturday, January 6, 2018

TiP'ing Over (Testing In Production)

Adding a new slot for TiP testing
TiP (Testing in Production) is an Azure feature allowing live, in-production testing of web apps. TiP routes a configurable portion of normal inbound production traffic to an app slot containing a new version of an app. You watch the app's performance and logs to see if all is well. I suppose this could be called Gamma testing, since it occurs after Beta testing but not yet taking a full production load. This approach to semi-production testing works well so long as data schemas are compatible between the two
versions.

Does TiP work? Well yes, it provides a useful and simple way to check a new software release prior to going fully live with it. That's business value. But there's a hitch at present that messes-up your app's configuration, causing 404's whose rectification requires (for now, anyway), deleting and redeploying the app and enduring a service outage. Oops.
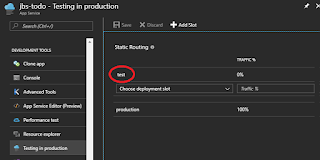
Slot configuration after creation

TiP is available to any app that can have slots - Standard or Premium level App Service, etc. Upon setup, TiP will create a new slot and install static traffic routing, using weighted-mode traffic distribution. You decide how much traffic goes to the test slot, from 0 to 100%. The traffic manager is not directly visible via the portal, but the slot appears as a new Web App per usual, and is visible.

Once TiP warms-up, a percentage of clients will get a cookie that when submitted to Azure on a subsequent request, will direct their traffic to the test slot. That's a nice approach, until it isn't.

Cookie: [x-ms-routing-name: your-test-slot-name]

Failure Mode 1 - TiP Cookie Persistence gives 404s


HTTP 404 with x-ms-routing-name cookie
If you've completed TiP testing and decide to tear-down the test environment - a perfectly normal thing to do in a cloud deployment - you're left with an issue. Clients with the slot cookie will continue to present it, but the traffic routing won't know about the slot anymore. An HTTP 404 Not Found error is the result. See the Postman screen shot.

The solution is for the client to drop the x-ms-routing-name cookie. That's no problem if you're testing locally, with full control of clients and cookies, but what about the real production clients, i.e. your customers? Ergo Oops.

After removing the cookie, here's the new result in Postman - HTTP 200 OK. Much better.
HTTP 200 OK after removing cookie
HTTP 200 OK after removing cookie

Failure Mode 2 - The Story of a Mucked-up Web App


There's no clear way to comprehensively remove TiP artifacts via the Azure portal, so when I completed testing, I just deleted the slot and the slot's Web App manually. That stopped those billing charges. As mentioned before, the implied existence of a static traffic routing didn't leave a visible artifact (such as a router, load balancer, etc.), so I couldn't take any action on it.
Failure creating new slot

A bit later, I decided to do another TiP session, but could no longer make new TiP slots using the original Web App as configuration source (this is an option during slot creation - see image above). Attempting to do so yielded this error message.

Figuring that there was possibly some "dirty" JSON configuration somewhere, I searched all the config files I could find, but  couldn't locate "test" - the slot's name - in any of them.

Looking for a work-around and based on knowing a wee bit about how software works, I tried creating another slot using a different name ("anyone" - see image) and for Configuration Source, I chose Don't clone configuration from an existing web app. This worked, or so I thought. The slot got created and I could see its resources in the portal, just as before.
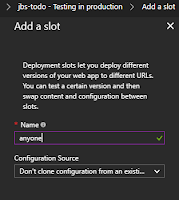
New slot configuration
I configured the new slot for traffic, fixed my Postman session as explained above, and fired-off a new POST. Got a 404; what?! I confirmed that the slot was indeed up by using the direct URL to it; only the request to the primary URL (and through static traffic routing) got the 404. This didn't make any sense - all web apps were up and running, and the cookie was set properly.

Keep in mind that this broken configuration, and the 404, was in live production.

At this point, TiP testing is hosed for the Web App, so I reset test traffic to 100% for the original Web App, and 0% for the broken slot. Then I removed slot resources as done above. This restored normal production operation, except for the cookie issue mentioned above, which likely means that static traffic routing is still trying to function.

As a side note, the 404s seem to come from IIS, based on header information I saw, even if the app uses Kestrel. TiP apparently puts some infrastructure between the client and the web app, and that's likely what generates the cookies too. It's not entirely possible to discern this magic invisible infrastructure, but enough symptoms emit to yield a good guess.

How to fully fix the Web App


Desiring to restore the Web App completely, and rid the configuration of any bad settings, I found no other solution than to delete the app (but leave the Web App Plan). Then I recreated it, reconnected it to source control, and triggered a redeploy. This got everything back in a few minutes for this very small test. Having source-control based deployment is really nice for this case and it nearly automated the restore. Nonetheless, this approach did cause a brief service outage - in production.

I'm hoping that this entire behavior is a bug that'll one day be fixed, but for the meantime you might just want to consider testing the good old-fashioned way - not in production.

References